
The Agrology Grower Portal.
Dig Deep Into Your Soil & Your Data.
The Agrology Grower Portal empowers growers to customize, visualize and apply data to their business needs.
Dig deep into ground-truth data on irrigation, smoke taint risk, moisture levels, weather and microclimates, pest and disease pressure, soil carbon flux, nitrous flux, and more.
The Perfect Complement the Agrology Mobile App.
With the Agrology Grower Portal users can:
Easily create polished reports in minutes.
View in-depth data overlays and see how different practices intersect with each other.
Visualize predictions and plan ahead.
Create custom charts based on specific needs.
Easily export data.
Focus on what they do best: growing!
Visualize It For Yourself.
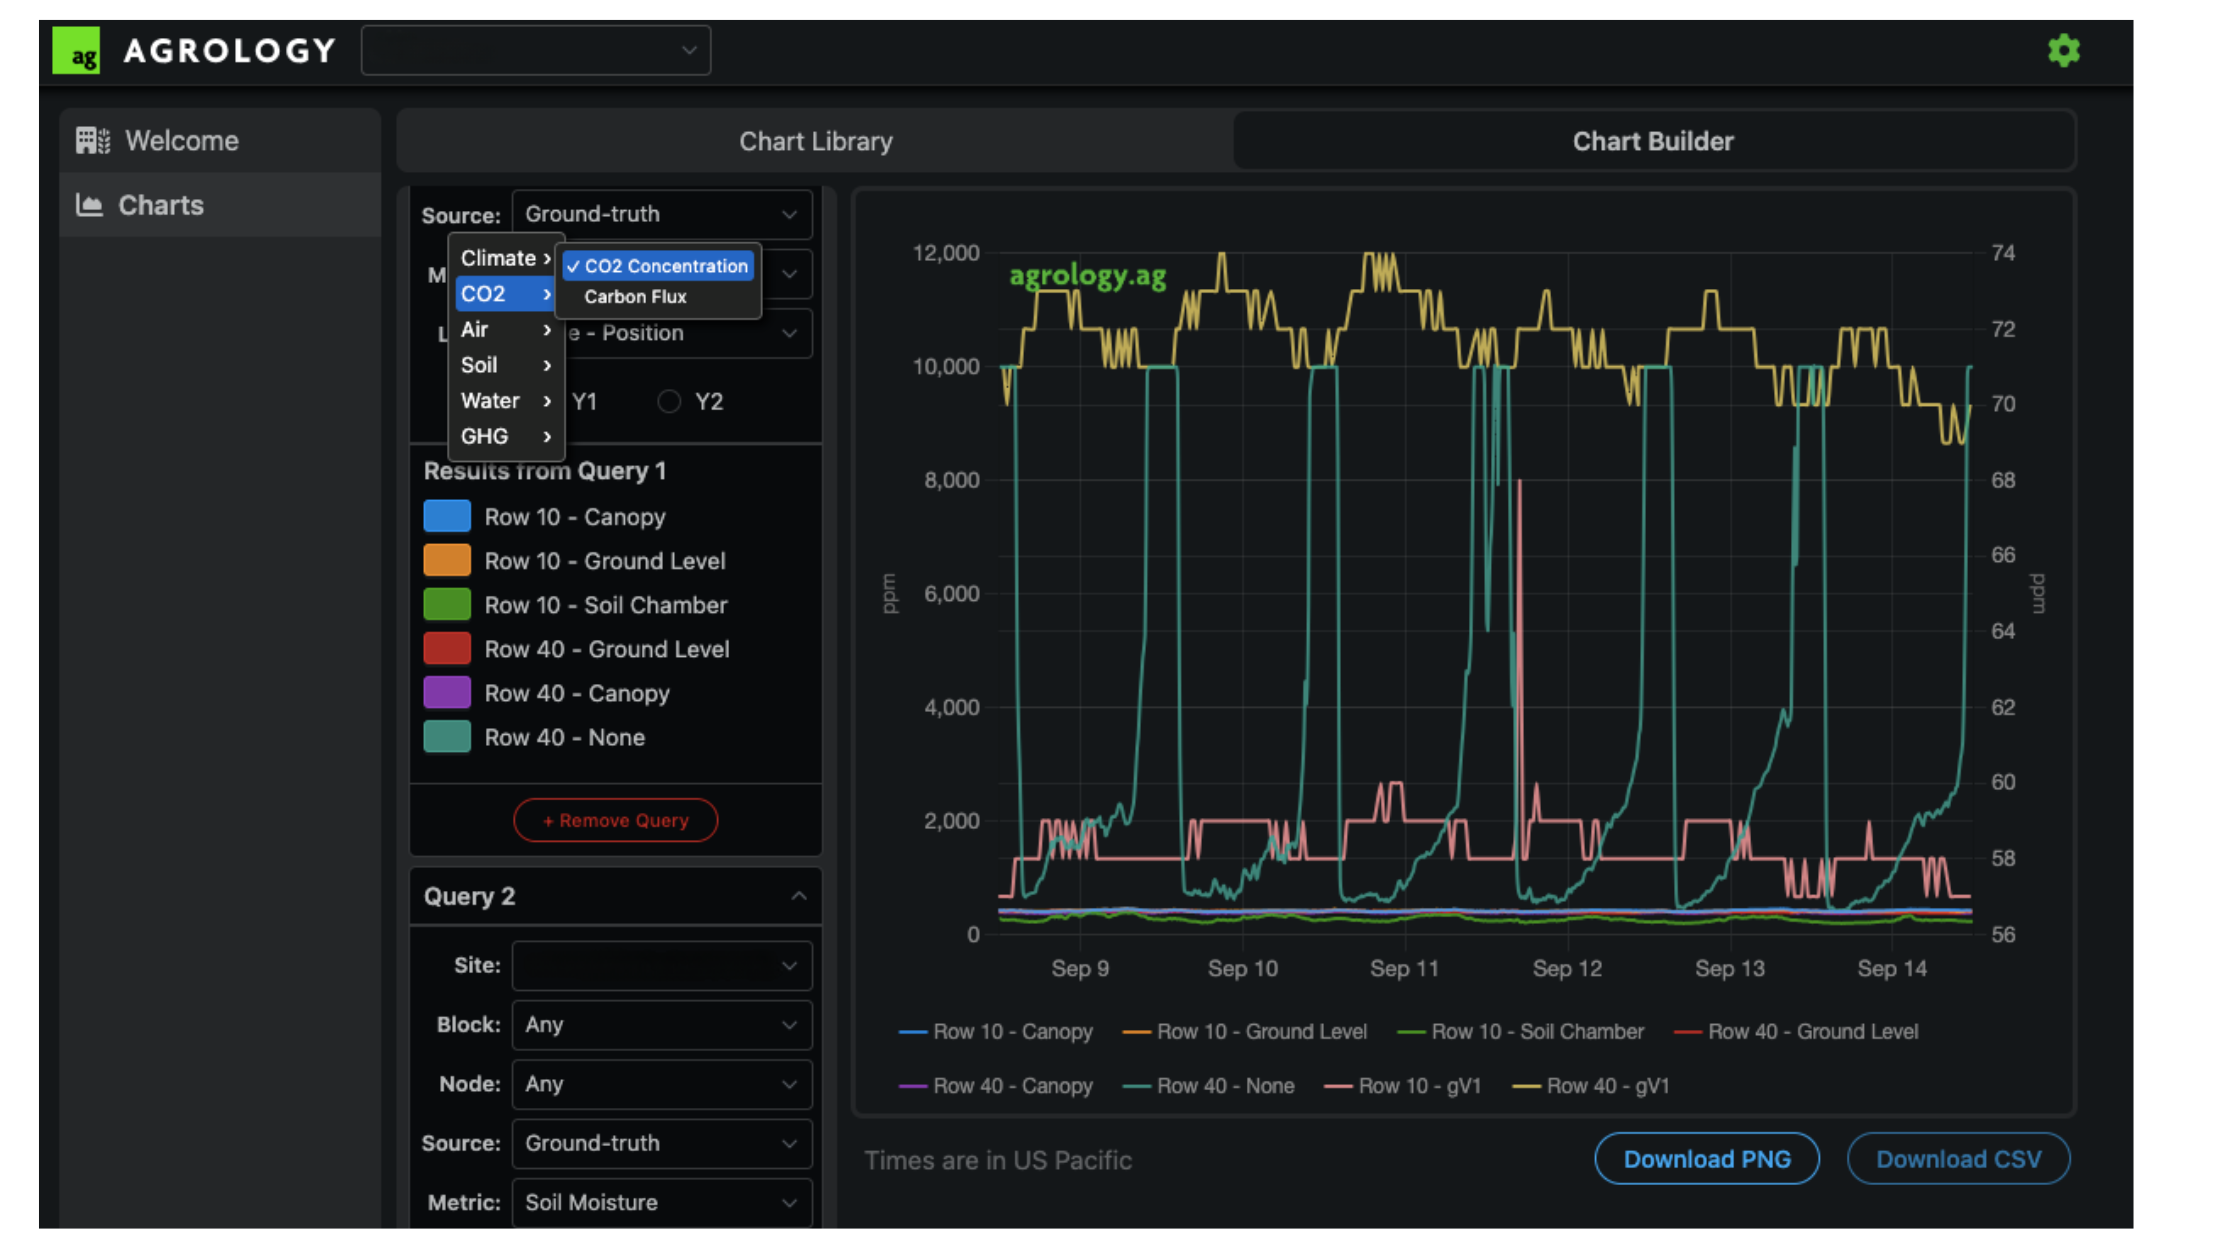
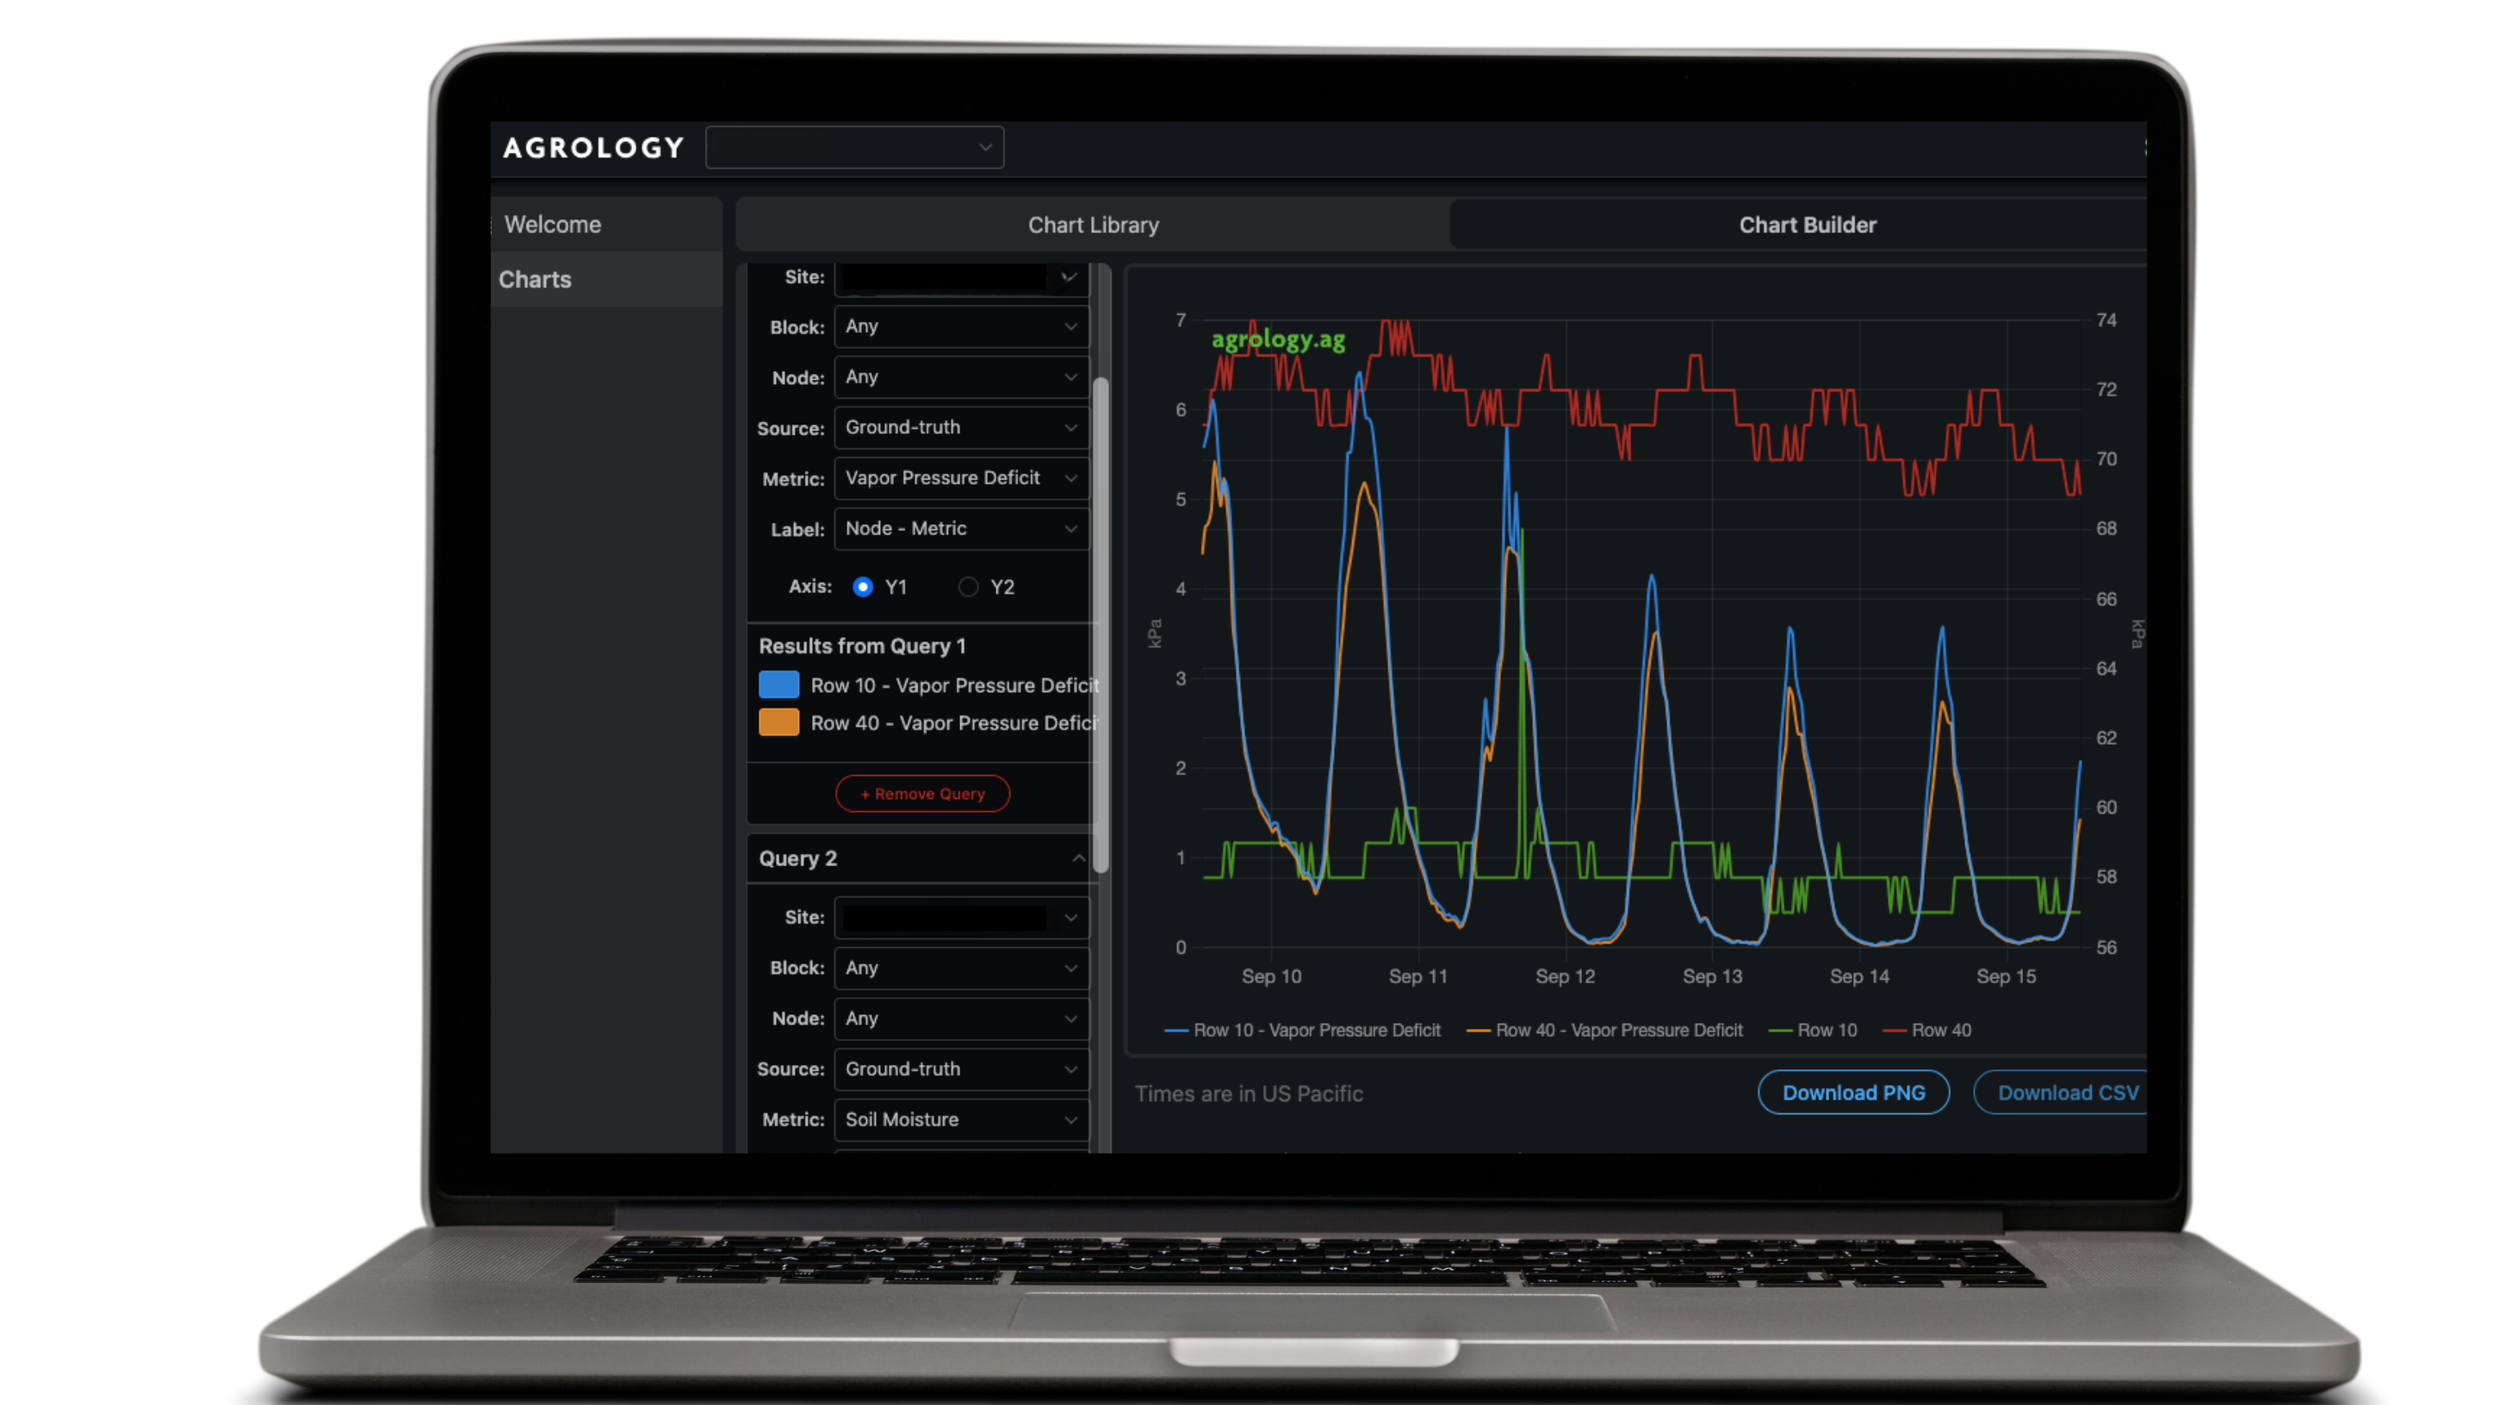
Overlay of C02 Flux With Soil Moisture
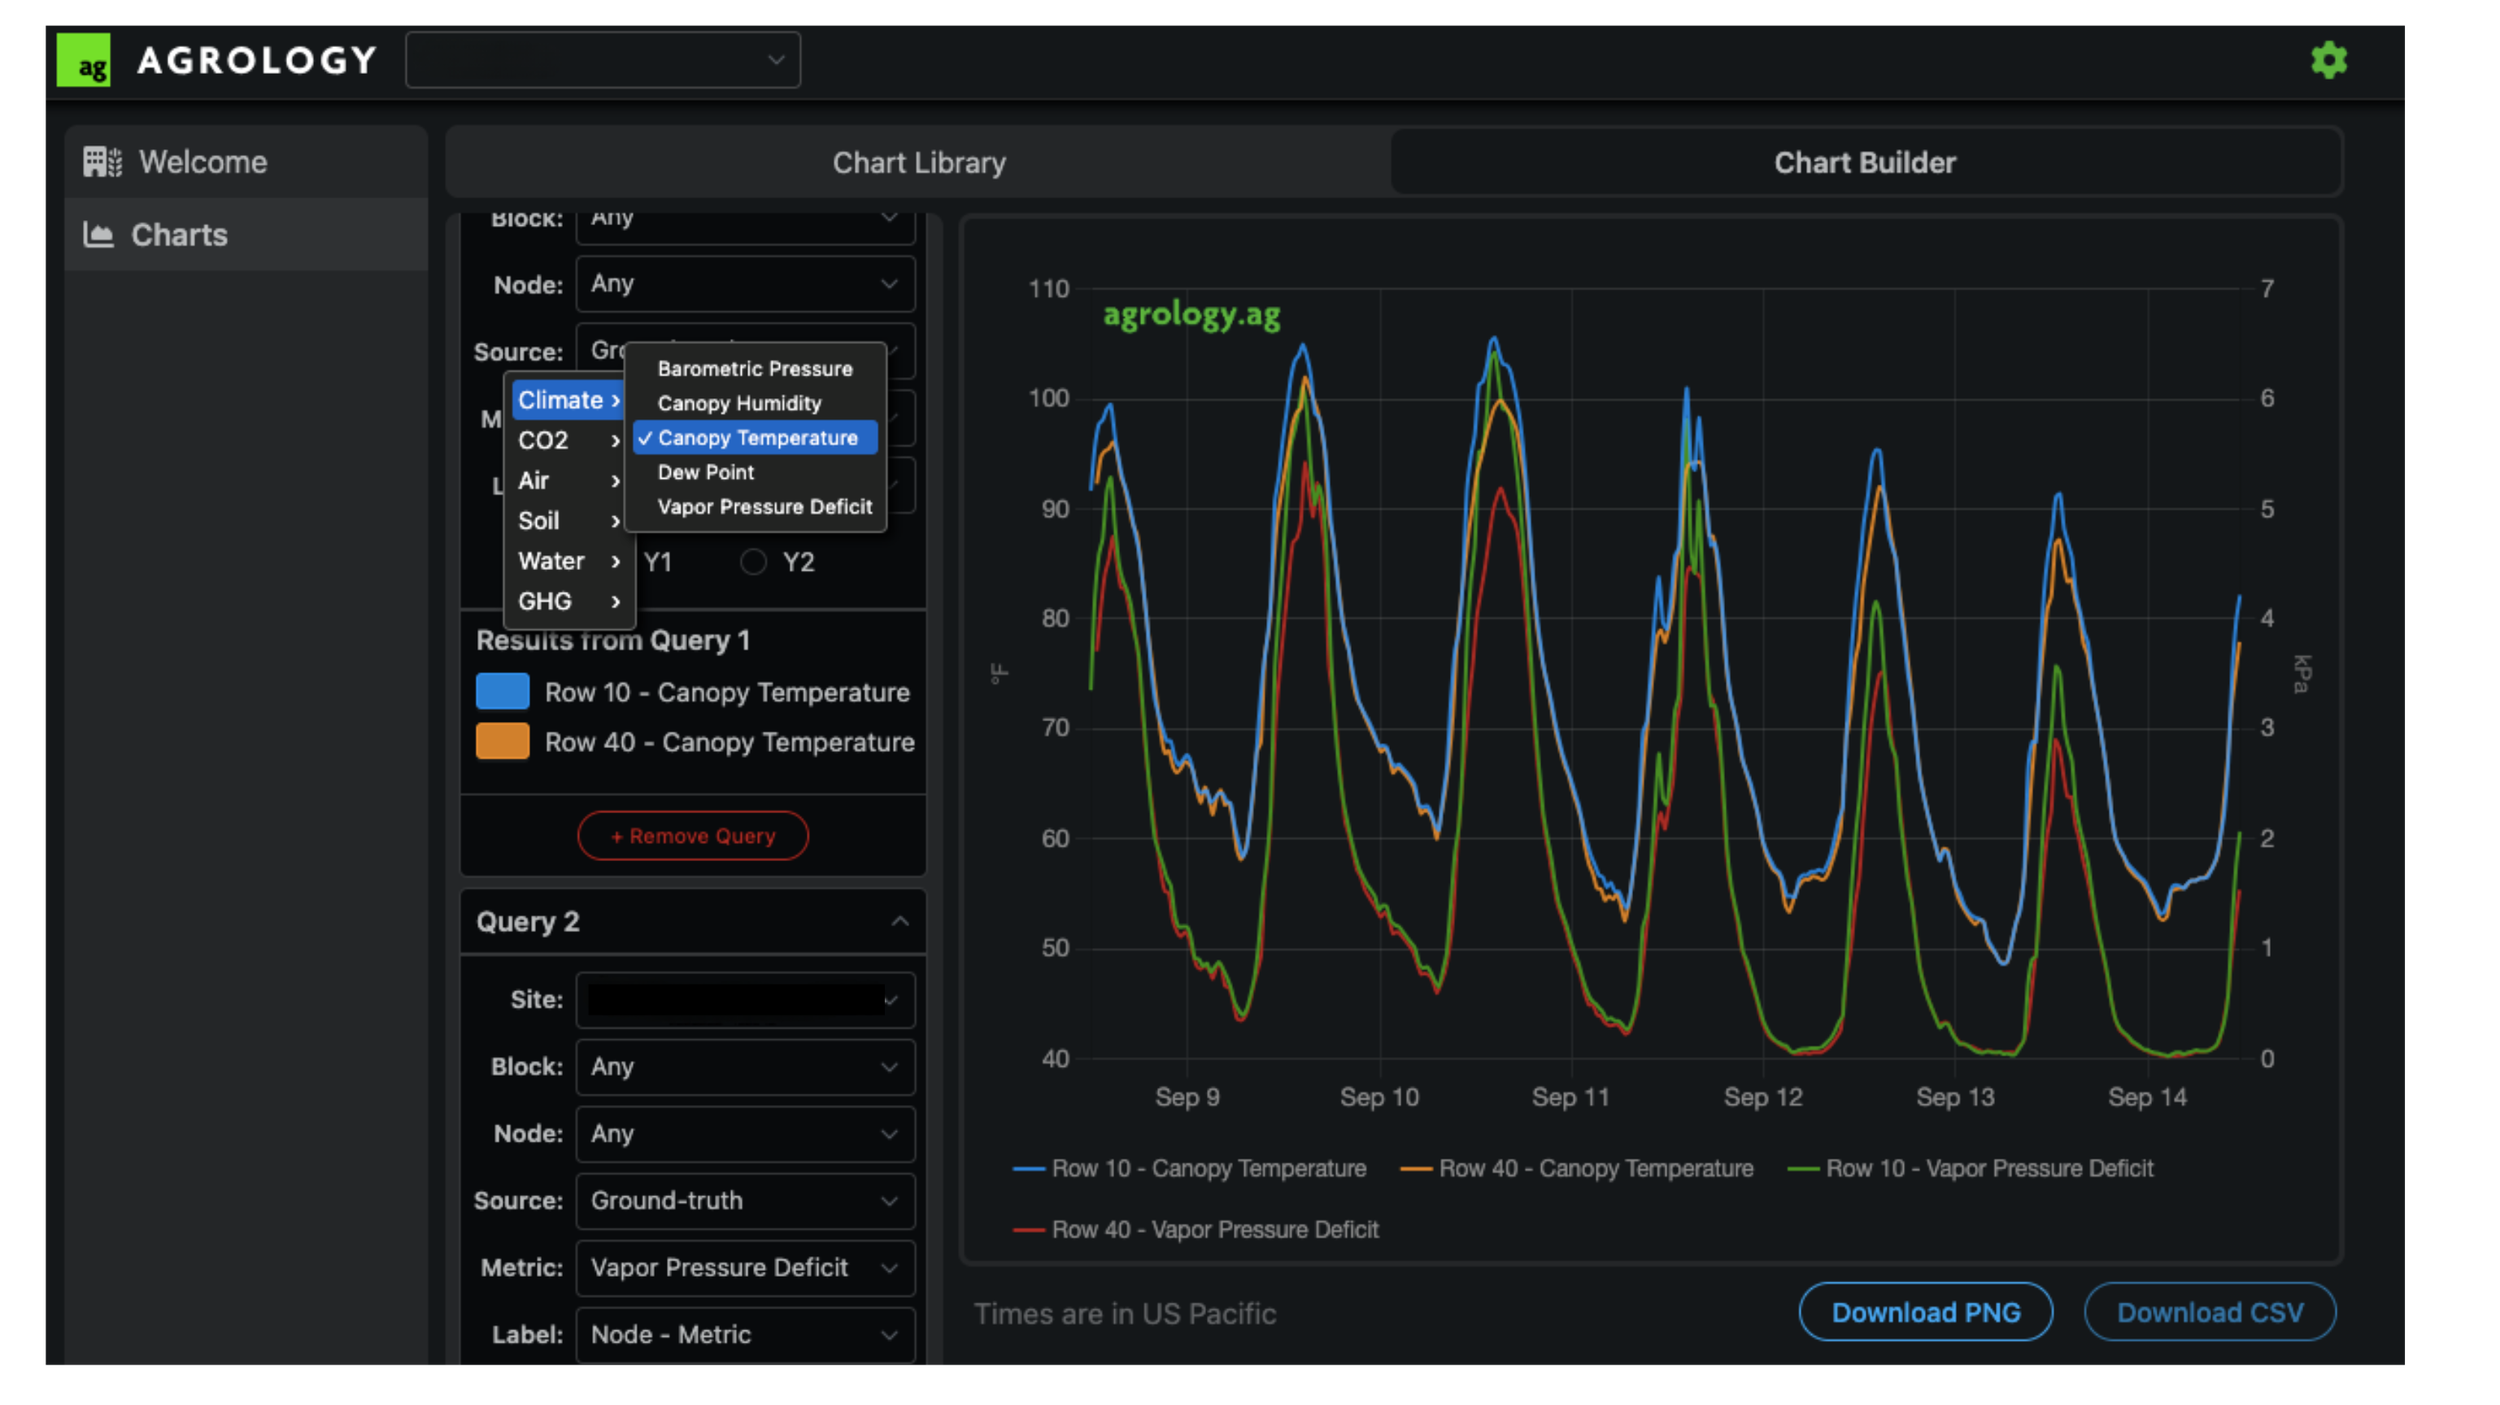
Overlay of Temperature With VPD
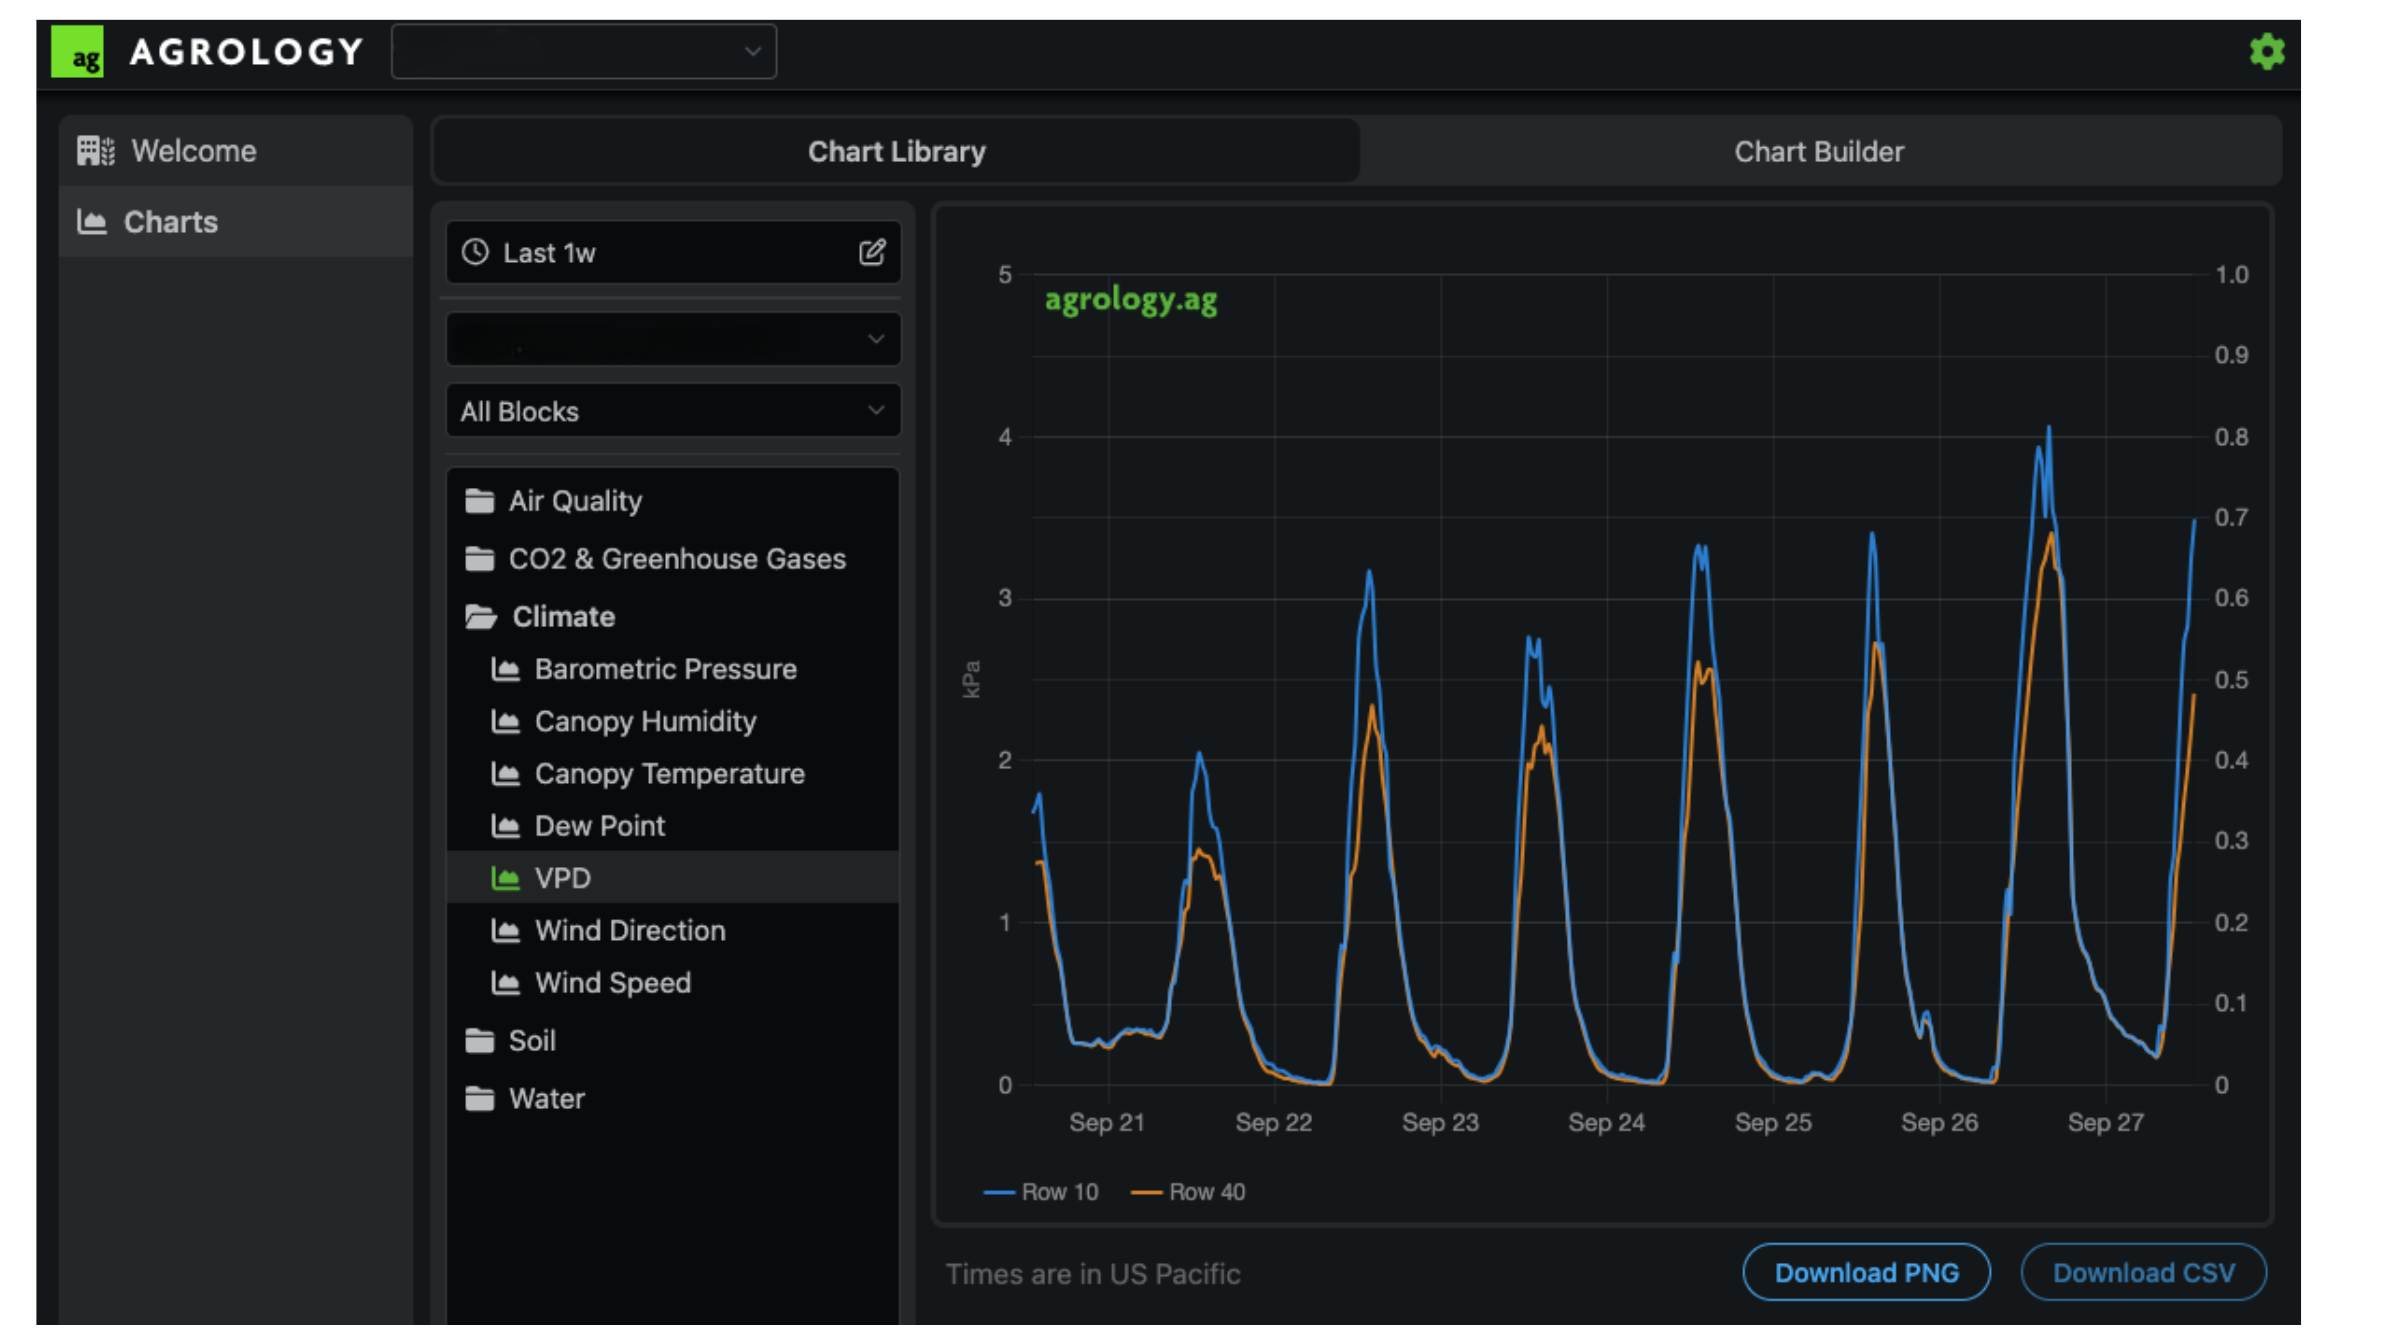
Chart Library
“The Agrology Grower Portal provides a comprehensive dashboard view of data that growers can really dive into and quickly understand what is happening down to the block. It’s a powerful tool for any grower, especially those who want to be more regenerative and have climate smart goals.”

Built For Our Customers
Agrology customers were asking for a data deep dive and the ability to fully customize their data to fit their unique business needs, and the Grower Portal was the answer.
Want to know more?
Read our press release or reach out to our sales team for more information.